Beans are a key food for much of the world’s population and a key ingredient in traditional recipes worldwide. Dry beans belong to the diverse Fabaceae family,sometimes referred to as Leguminosae. Beans are often called by other names, such as legumes or pulses. Yet not all legumes are beans and beans harvested in the green state are considered vegetables. Conversely, when harvested in the dried grain state, the edible seeds are called pulses. Beans are known as an economical source of protein. In addition, they are low in fat and a rich source of fiber and other important nutrients. Also, they are associated with a wealth of environmental and human health benefits, such as improved soil fertility and reduced risk of chronic disease. Dry beans are shelf-stable and can be kept safely at room temperature. They should be stored in a food-grade container or bag in a cool, dry, dark place. Warmer temperatures, higher humidity, and longer storage times can all contribute to longer cooking times. There are many countries in the world that producing dry bean. India takes the first place in the producing of dry beans, where it produces about 6.4 million Tonnes. The second place is Myanmar where it produces 5.47 million Tonnes. Then come Brazil, then United State of America, China and many more countries.
After knowing the importance of the dry bean how we can distinguish between them. There are about 18 kinds of dry beans in the world.This Machine learning algorithm is to predict the kind of beans out of 7 types of beans. The seven dry bean kinds are “Horoz, Bombay, Dermason, Barbunya, seker, Sira, Cali”.
DATASET:
I obtain the training dataset form the UCI Machine Learning Repository website. For this dataset Seven different types of dry beans were used in this research, taking into account the features such as form, shape, type, and structure by the market situation. A computer vision system was developed to distinguish seven different registered varieties of dry beans with similar features in order to obtain uniform seed classification. For the classification model, images of 13,611 grains of 7 different registered dry beans were taken with a high-resolution camera. Bean images obtained by computer vision system were subjected to segmentation and feature extraction stages, and a total of 16 features; 12 dimensions and 4 shape forms, were obtained from the grains. The 12 dimensions are:
- Area: The area of a bean zone and the number of pixels within its boundaries.
- Perimeter: Bean circumference is defined as the length of its border.
- Major axis length: The distance between the ends of the longest line that can be drawn from a bean.
- Minor axis length: The longest line that can be drawn from the bean while standing perpendicular to the main axis.
- Aspect ratio: Defines the relationship between Major axis length and Minor axis length.
- Eccentricity: Eccentricity of the ellipse having the same moments as the region.
- Convex area: Number of pixels in the smallest convex polygon that can contain the area of a bean seed.
- Equivalent diameter: The diameter of a circle having the same area as a bean seed area.
- Extent: The ratio of the pixels in the bounding box to the bean area.
- Solidity: The ratio of the pixels in the convex shell to those found in beans.
- Roundness: Calculated with the following formula: (4piArea)/(Perimeter^2)
- Compactness: Measures the roundness of an object: (Equivalent diameter)/(Major axis length)
Form my data set I know it is a multivariate classification problem where my target is the Class columns which consist of seven different classifications which are are “Horoz, Bombay, Dermason, Barbunya, seker, Sira, Cali”.
Models:
baseline
since this is a classification problem my baseline will be the majorty class of the y_train split dataset. that mean if i chosee to predict that all my prediction is one clase i will get the highest accuracy by chosing the mojority class. so i used value_counts(normalize=True).max() to get the maximum normalized value count of the class. i get my base line to be 26.21%.
Logistic Regression
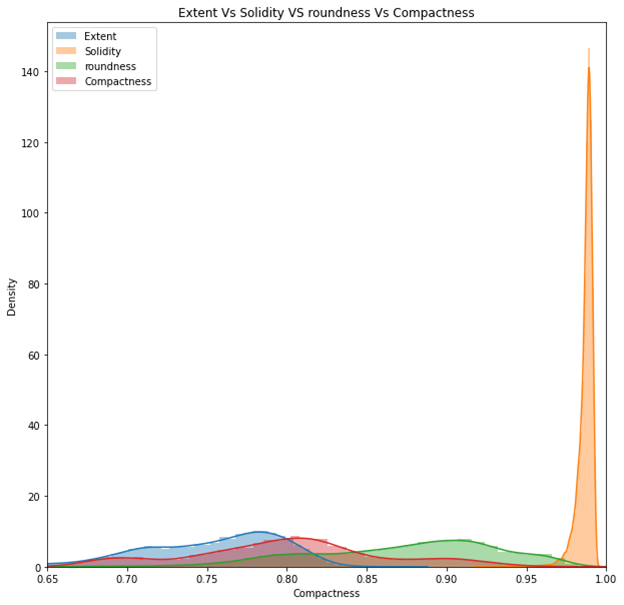
I to further understand the data I used visualization tools like histograms and plots to further understand the data. The first visualization tool I used is histograms plot to know the distributions of the data. Since Extent, Solidity, Roundness and Compactness feature have similar distribution so I did them in one plot.
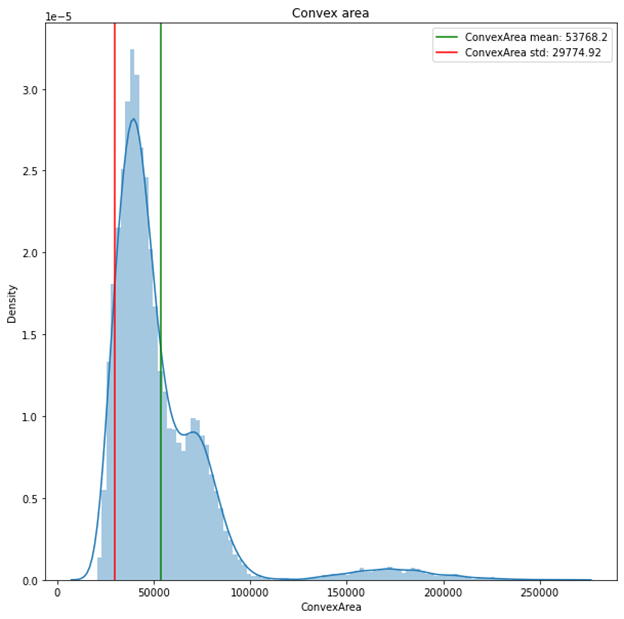
Another histograms plot was the convex area feature
The second visualization tool I used is heatmap to understand the correlation of the model and know if there is a high correlation or low correlation between the features.
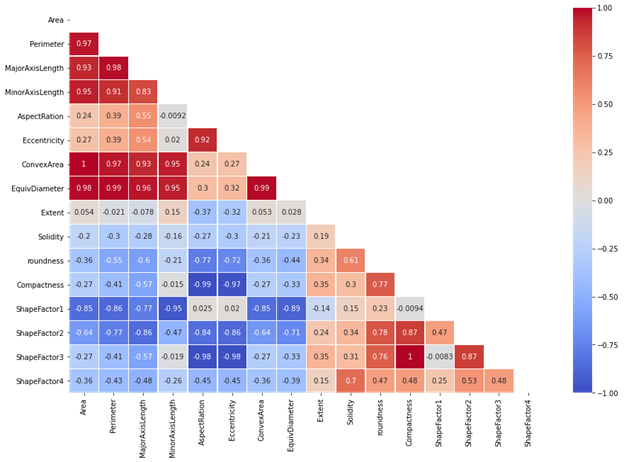
Figure 1: correlation heatmap
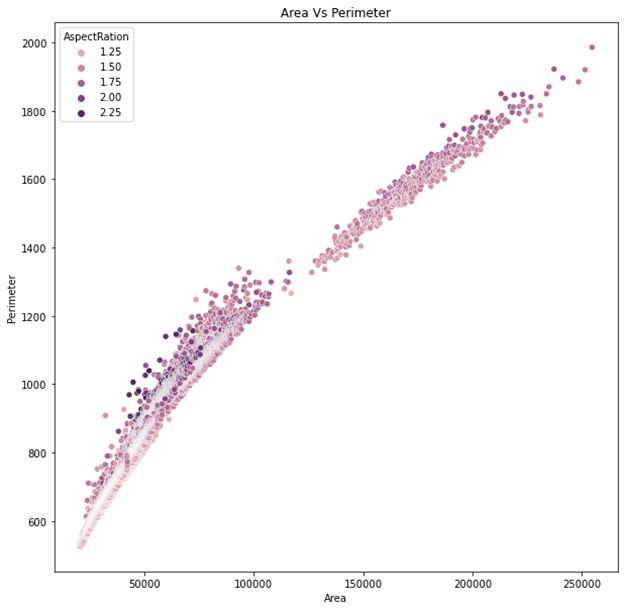
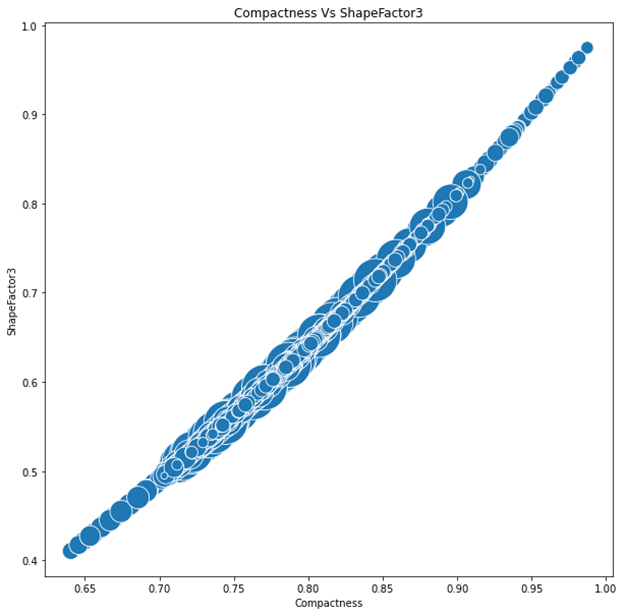
Looking at the heatmap I can see that most of the features has a high correlation. Also, that convex area and Area feature having a correlation of 1. Same thing with Compactness and Shape factor 3 feature. Furthermore, I did a scatter plot to see the correlation of the area and the perimeter which have a high correlation of 0.97.
Then I did a bubble plot to see the how is the correlation between compactness and shape factor is one. And I set the size of the bubble to be the area. As we can see in the plot the correlation is one, we also can see that in the middle of the correlation scatter the bigger area and on both end of the plot in the smallest area.
Looking these plots helped me decide to use a regression model for this problem since the model have a high correlation, I believe a Regression model would be very useful. Since this problem is a classification problem, I will use a Logistic Regression Model. Fitting a Logistic Regression algorithms, I get an accuracy score of 0%, which is really not realistic so I needed to make sure that may data is right. I looked at my data and found that my data is not randomize and my split was not right where my model wasn’t train right. So I needed to randomize the data and re do the algorithms. After randomizing the data and refit the model I got the accuracy score to be 91.13%. to ensure my model is right and I get a right validation accuracy I used Cross-validation where I got an accuracy mean score of 91.63% for 5-fold. To ensure that my accuracy is right I used the confusion metrics to get the precision, Recall, and F1-score.
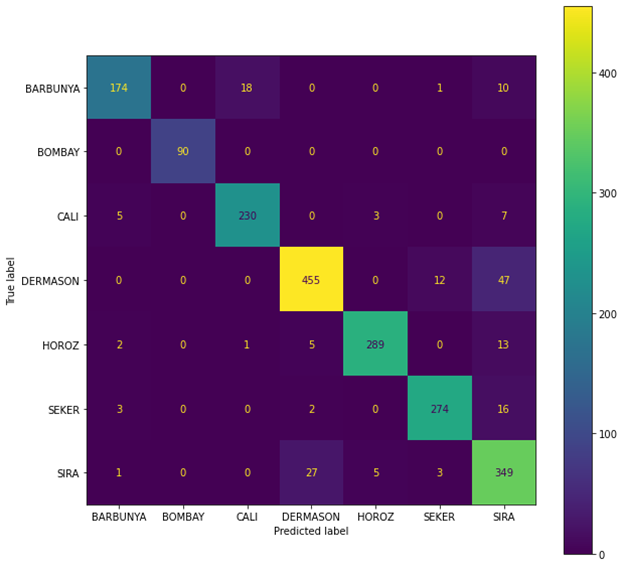
Figure 2: Confusion Matrix for Logistic Regression
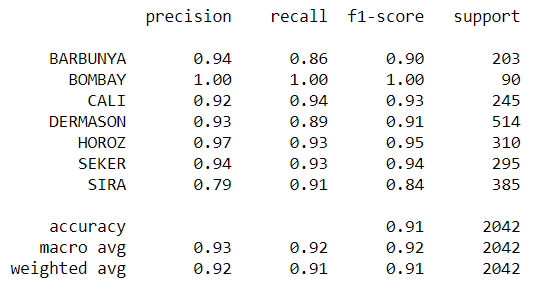
Figure 3: Precision, Recall, and F1-score of the logistic Regression
Random Forests Classifier
Then I used a RandomForestsClassifier model. Using a classifier model I got a high accuracy then the logistic Regression model. I got an accuracy of 92.48% when using the RandomForestsClassifier. To ensure the accuracy increase was because the classifier model did better than the Regression I compeered the confusion matrix and the precision, Recall, and F1-score between the two model.

Figure 4:Confusion Matrix for Random Forest
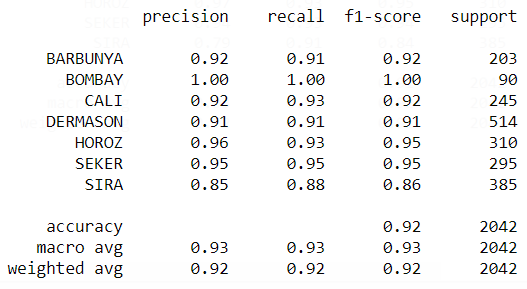
Figure 5: Precision, Recall, and F1-score of the Random Forests
XGBoost
Looking at figure 3 and figure 5 we can see that Random Forest model have a higher Precision, Recall, and F1-score than the logistic Regression. Another model I used was XGBoost which gave me the highest accuracy of all the model. XGBoost give me an accuracy of 92.67%.
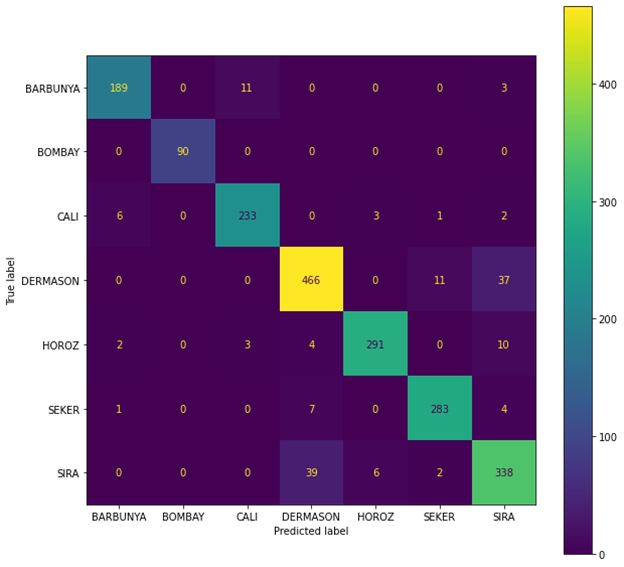
Figure 6: Confusion Matrix for XGBoost
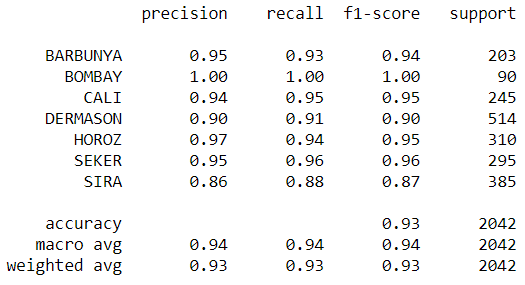
Figure 7:Precision, Recall, and F1-score of the XGBoost
After chinking the confusion matirx I can ensure that using an XGBoost will give us the highest accuracy score then random forest or logistic regression.